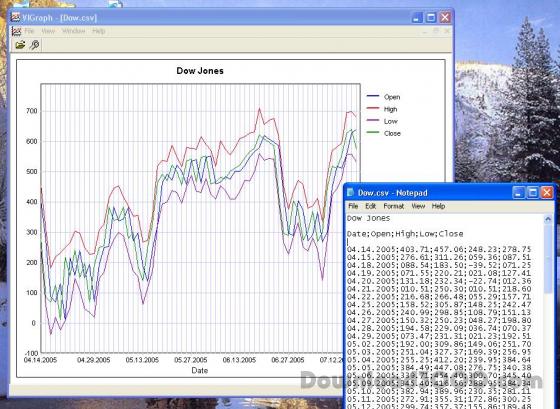
VIGraph It draws a diagramms from your txt-data files. It scales your diagramms automatically or manually. Simply make a txt or csv (ASCII) file like that: Dow Jones Date; Open; High; Low; Close 4.14.2005; 10403.71; 10457.06; 10248.23; 10278.75 4.15.2005; 10276.61; 10311.26; 10059.36; 10087.51 Run VIGraph and open that file. You will get a diagramm with 4 colored lines (for Open; High; Low; Close).
Publisher description
It draws a diagramms from your txt or csv data files. It scales your diagramms automatically or manually. You can open as much data files as you need simultaneously. Columns in the txt-files can be divided by commas, tabulators or semicolons.
Related Programs

Perfect UML Diagram and Software Diagram Tool

Nevron Diagram for .NET 2012.1
Professional diagramming component for .NET

Perfect UML Diagram and Software Diagram Tool

Net Activity Diagram 2.5 SR1
Net Activity Diagram.See Your Network Traffic

Sequence Diagram Editor 1.6.3
Create and edit UML sequence diagrams.

